
For a Printable Version, Click Here.
Avoiding Dynamic Memory Problems:
A New Solution for Developers
Table of Contents
Introduction
One of the most important features of modern computing languages is
the ability to dynamically allocate memory blocks. This freedom allows
algorithms to be created in much more flexible ways than is possible
with static memory allocation. However, this freedom comes with a price.
A program does not always use dynamic memory in the manner intended by
the developer. As a result, memory leaks, bottlenecks and other problems
arise unexpectedly. Traditionally, the only way to counter such problems
has been to add a lot of extra code to your application to print out
information about the memory blocks that get allocated and freed.
Unfortunately, this process is at best tedious and at worst not very
informative.
This paper will describe the types of dynamic memory problems which
developers and end-users frequently encounter. A new tool will be also
be described which helps developers solve memory problems quickly and
intuitively.
Use and Abuse of Dynamic Memory
Many modern algorithms make heavy use of dynamic memory, but few
take any great precautions to insure they achieve the best possible
use of the memory system. As a result, many applications can benefit
from streamlining their memory usage or modifying the order of their
allocation requests to reduce the fragmentation that takes place when
memory is allocated and freed.
Many algorithms also contain subtle "memory leaks" in
which the program consumes growing amounts of memory as it runs, until
the resources of the host are finally exhausted and the program crashes--
sometimes days or even weeks after starting.
As stated previously, the only solutions to these problems have
involved print statements that were time-consuming to set up and not
always helpful once added. Fortunately, a new solution is now available
to aid developers in optimizing memory usage.
A New Solution to Overcoming Memory Problems
Inuse is a graphical tool designed to help developers avoid
memory problems by displaying and animating in real time the memory
allocations performed by an application.
By watching your program allocate and free dynamic memory blocks,
you gain a better understanding of the memory usage patterns of your
algorithms and also an idea of how to optimize their behavior.
Inuse allows you to
- Look for memory leaks.
- See how much memory your application uses in response to
particular user events.
- Check on the overall memory usage of your application to
see if it matches your expectations.
- Look for memory fragmentation to see if different allocation
strategies might improve performance.
- Analyze memory usage by function, call stack, and block size.
Avoiding Memory Problems with Inuse
Inuse can help you detect and avoid more than just memory leaks.
It can show you most common memory problems, including memory blowout,
memory fragmentation, memory overuse, and memory bottlenecks.
Memory Blowout
Many programmers are not aware of the danger which memory blowout
poses for commercial and industrial applications. Memory blowout is
very common in many programs because the operating system allocates
pages of memory to the program and never releases them. Other programs
running on this machine will then be starved for memory and crash.
How does memory blowout happen? A program allocates a large chunk
of memory for use and after it is done with it, frees it. At that
moment, the freed memory can be reused by the program but it is not
released to the operating system. The reason for this is that when
memory was allocated by the program, the operating system allocated
all the needed memory pages. The operating system then will not release
the memory pages, even after they are freed by the program, until the
program is exited. As a result, other programs running on the machine
needing memory will ultimately crash.
Inuse can help you prevent memory blowouts.
Figure 1 shows the Heap History report
generated by Inuse for a program showing memory blowout. This problem can
be easily identified by the large size of the heap and the small amount
of allocated memory. This shows up on the Inuse display as a low ratio
of allocated memory to heap space. Without Inuse, it would be difficult
if not impossible for most developers to detect this impending
"catastrophe".
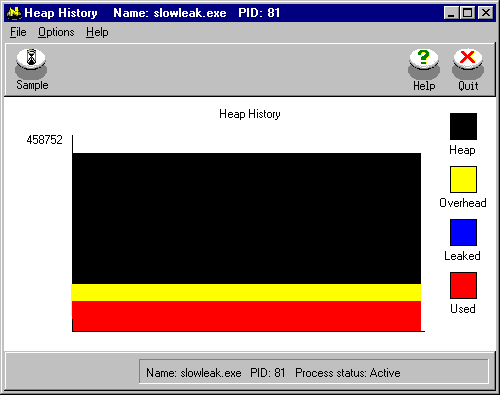
Figure 1. Memory Blowout
Memory Fragmentation
Most programs which use a lot of dynamic memory are risking the danger
of memory fragmentation. Memory fragmentation can be caused by overuse of
memory. This slows down memory allocation.
For example, when a program allocates and frees small and large memory
blocks interchangeably, the programmer will expect the total amount of
allocated memory to remain constant. However, memory allocation routines
can not fit blocks of memory in freed spaces that are the wrong size.
This will lead the program to request new pages for memory from the
operating system. This will cause the program to consume more memory and
ultimately run out of dynamic memory without leaking a single byte.
Developers can use Inuse's Heap Layout report to monitor memory
fragmentation in their program (See
Figure 2). They can immediately see
the layout of dynamically allocated blocks and the free spaces in between
them. By simply clicking on a block, the status of the block, its memory
address, its size, and the stack trace where it was allocated are
displayed.
Another way that memory fragmentation shows up on Inuse is by a large
amount of Overhead in the Heap History graph.
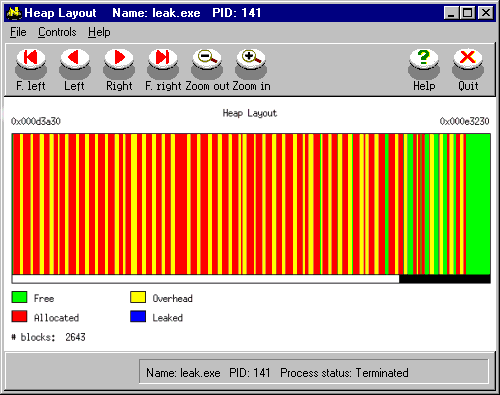
Figure 2. Monitoring Fragmented Memory
Inuse can help developers identify and overcome many additional
memory problems, including Memory Overuse and Memory Bottlenecks.
Memory Overuse (Hogging)
This is a common problem for many programs. Memory is allocated by a
program and never freed. The memory is not leaked, because pointers still
stay in the program and can be freed, but the program does not do it. As
a result, the program uses more and more memory until it runs out and
crashes.
Memory overuse can be viewed on the Heap History graph. If the amount
of leaked memory is negligible and stays constant, or Insure++ does not
report any leaks but Heap History exhibits a stairway pattern (as in
Figure 3), the program is hogging memory
and eventually will run out of memory. In this case, the programmer should
use the Query report to look for totals of memory allocated for different
stack traces. The stack trace for which the total amount of allocated
memory continues growing likely points to the offending line of the source
code (see Figure 4). At that moment, the
programmer should analyze the code and verify that indeed, the program
needs to allocate memory at that stage and needs to keep it. If it doesn't,
this is an algorithmic problem and needs to be fixed.
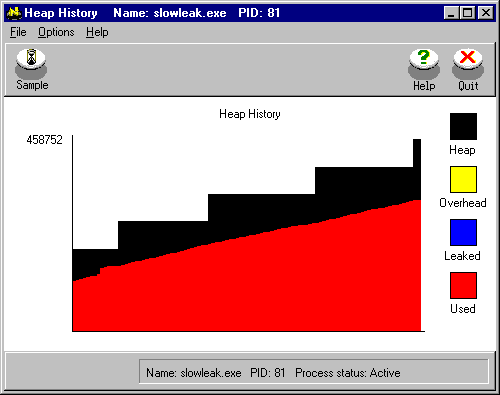
Figure 3. Memory Hogging
Memory Bottlenecks
Bottlenecks occur when an operating system spends more time paging
memory than running the program. Memory bottlenecks frequently arise
when a program uses large amounts of dynamic memory or calls large
amounts from different parts of the program. They are particularly
problematic because a program may perform well in-house but stop dead
in the field.
Paging can slow down execution of the program by a factor of 100,
effectively stopping the program from running. A program may perform
in-house without having to page, but this can change when different
conditions are introduced. A customer might have less memory or be
crunching much more data than the program was tested with. As a result,
the program uses a larger portion of memory and forces the operating
system to page. The problem is compounded if the program accesses a
lot of memory from different locations.
To avoid this problem, the program should be analyzed in respect to
how much memory different parts of the program need and if that need is
warranted. The Query feature of Inuse enables developers to calculate how
much memory is allocated by a specific path, routine, or block type.This
type of analysis is critical for understanding algorithmic problems and
can make it much easier to improve memory performance.
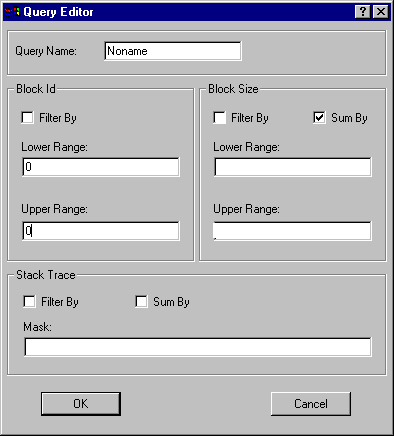
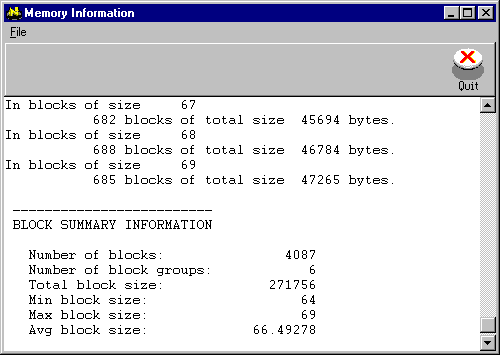
Figure 4. Analyzing Memory with Query
Inuse Gives You the "Truth" About Your Program's Memory
Use
When developers write their programs, they usually have some idea
how memory should be allocated by the program. This idea is typically
far from what the program is actually doing. Inuse lets developers see
the "truth" about their programs by visualizing memory
allocation at run-time.
Developers can single-step the program by setting breakpoints at
calls to malloc, free, new, delete, realloc and then watch allocations
in Inuse as they happen. This works as a confirmation of an algorithm's
performance and it shows if the program works correctly or not.
Single-stepping should be done just after a program is first built. By
checking memory usage early, you can save a lot of headaches down the
road. Also, you can spot significant algorithmic problems.
It is particularly useful at this stage to look at the Block Frequency
graph of Inuse (Figure5). This graph
will show the distribution of memory blocks.
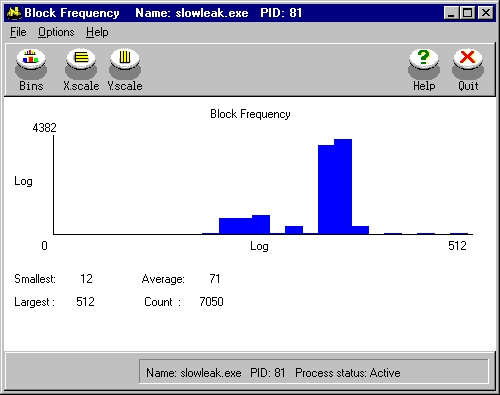
Figure 5. Viewing Block Frequency
Cleaning Up Leaks
Not all leaks in a program have to be cleaned. Leaks are only deadly
if they reoccur constantly. Leaks which occur only at the beginning of
a program can, in most cases, be ignored. However, leaks which occur
during the execution of a program--especially ones in parts containing
loops--are deadly and need to be fixed. The severity of a leak can be
easily determined using the Time Layout display of Inuse. This diagram
shows blocks as they are allocated in time sequence. All leaks
concentrated at the initial stage of program can be safely ignored. On
the Time Layout display, clicking on a block will show its size,
address, and stack trace where it was allocated. (See
Figure 6).

Figure 6. Checking the Timing of a Leak
Using Inuse with Insure++: An Example
Running Inuse with Insure++ can be very effective in detecting
different dynamic memory anomalies, as you are provided with the most
thorough debugging information available combined with the unique visual
perspective of Inuse.
Consider the following program:
         1: #include <stdlib.h>
         2: #include <stdio.h>
         3:
         4: #define MAXSLOTS    16
         5: main()
         6: {
         7:             int i, which;
         8:             char **pp;
         9:
        10:             while(1) {
        11:                     pp = (char **)malloc(MAXSLOTS*sizeof(char *));
        12:                     for(i=0; i<MAXSLOTS; i++) {
        13:                             pp[i] = malloc(64+i);
        14:                     }
        15:                     sleep(1);
        16:                     for(i=0; i<MAXSLOTS; i++) {
        17:                             which = (rand() >> 4) % MAXSLOTS;
        18:                             if(pp[which]) {
        19:                                     free(pp[which]);
        20:                                     pp[which] = 0;
        21:                             }
        22:                     }
        23:                     free(pp);
        24:             }
        25:             exit(0);
        26: }
The above program has a memory leak. One way to detect the leak is
to compile the program with Insure++ and run it. Insure++ will report
an error at line 23 and give you a complete diagnosis of the problem.
The leak will also appear graphically in Inuse reports, letting you see
exactly how it affects the program at run-time. By running Inuse and
Insure++ together, you are getting the ultimate memory checking solution.
You will be able to visually "see" the leak happen then get all
the information you need to fix the problem.
For more information on how Insure++ can automatically detect large
classes of memory, compilation, and run-time errors, reference ParaSoft
Technical Paper PS-9511-INS1.
Conclusion
Dynamic memory is a powerful and convenient feature of modern
computing languages. However, it can be difficult for a developer
to fully understand the implications of dynamically allocating memory
blocks in a program. Inuse was designed to automate this process and
present memory usage data in an intuitive, informative format. With
the introduction of Inuse, developers can finally understand just how
their programs are using (and abusing) memory.
For more information on Inuse or to obtain a copy of the program,
contact a Software Quality Specialist at 1-888-305-0041.
| 