How and Why to buy a Runtime Debugger
Table of Contents
Answer the following questions:
- Does your software have bugs that you know about?
- Does your software have bugs that you don't know about?
- How often do your customers report bugs that you never saw during
in-house testing?
- Does your company have "software gurus" that always
end up helping their co-workers with difficult bugs?
- Do you want to improve the quality of your software?
If the answers to any of these questions was "yes", you
would probably benefit from using runtime debugging tools.
Are you wondering why you need another debugger?
Conventional debuggers have been around for quite a long time, and
are really quite sophisticated. However, the successful use of a
conventional debugger requires at least three things:
- You must know that the bug exists.
- You must have at least some vague idea of where it comes from
and/or what causes it.
- That you have the required ability and time to use the debugger
to track down the problem.
Debugging in this way is quite a skill - one of the most obvious
differences between novice and experienced programmers is the time it
takes them to find complex bugs.
Runtime debuggers, on the other hand
- require no special skill to use, and
- find bugs that you didn't even know existed.
The trick is that a runtime debugger actually modifies your code so
that at runtime every memory reference is checked for validity.
The debugger keeps track of your program's memory and immediately complains
if you misuse a pointer, overwrite memory, free a block too many times,
use an uninitialized variable, and more.
Furthermore, it does this to your entire program, regardless of where
you think bugs might be found. It also doesn't make the simple errors
that humans do, which often introduces more problems while looking for
something else entirely!
In brief, you obtain the skills of a dedicated, expert programmer who
never makes a mistake, and who works incredibly quickly and reliably,
simply by using the debugging tool.
The power of runtime debuggers is so great that the market already has
several competing products. Before you buy one or more for your
project, you should understand some of the design trade-offs that have
been made and how these affect the ability of the tool to find the
bugs in your software.
What types of memory does it check?
Your program is basically made up of four different
types of memory.
- Global variables.
- Local variables, stored on the stack.
- Dynamic memory blocks, allocated on the heap.
- Shared memory blocks.
Many runtime debuggers only check dynamically allocated memory blocks,
which means that code such as
    foo() {
      char tmp[12];

      strcpy(tmp,
        "This string is too long!");
      return;
    }
would pass with no error found.
Does it check uninitialized memory blocks?
Forgetting to set a variable before using it is a common cause of
hard-to-track-down, unreproducable bugs. You should make sure that the
debugger you choose can find this sort of error, both during
compilation and at runtime.
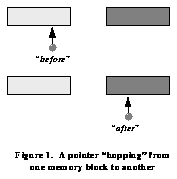
Is the checking done heuristically, or exactly?
Some runtime debuggers keep track of the behavior of all the memory
blocks and pointers in your program exactly. Others use heuristic
methods that occasionally have to "guess" at the program's
behavior. A typical symptom of such debuggers is that a pointer can
"hop" from one memory block into another without being
detected as an error, as shown in Figure 1.
Exact tracking methods understand the relationship between the
pointer and the first block and can successfully detect the
error when the pointer starts to point at the second block.
What are memory leaks and how do they affect applications?
One of the hardest bugs to detect using conventional testing is a
memory leak. A typical symptom is that a program runs well in-house
but starts to fall over when running at customer sites - particularly
on large problems.
The cause is that the application is allocating
blocks of memory but never freeing them. As a result, it continuously
uses more and more memory until the resources of the host computer are
exhausted and the program crashes.
As an example of what can
happen, consider the following piece of code:
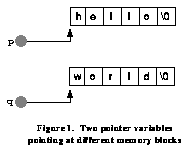
    1:  foo() {
    2:    char *p, *q;
    3:
    4:    p = malloc(6);
    5:    strcpy(p, "hello");
    6:    q = malloc(6);
    7:    strcpy(q, "world");
    8:
    9:    q = p;
   10:    free(p);
   11:    free(q);
   12:    return;
   13:  }
This code creates two blocks of memory and inserts two strings. The
situation at line 7 is shown in Figure 2.
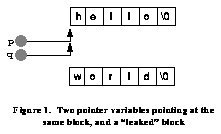
When line 9 executes, q is re-assigned to point to the
"hello" string, as shown in Figure 3. There is now no
pointer that points to the second string.
The two calls to free in lines 10 and 11 both attempt to free the
first block (a bug that you should make sure that your runtime
debugger can detect!) and the routine exits without freeing the
second string at all.
How does the runtime debugger detect memory leaks?
It is important to understand how a runtime debugger detects memory leaks.
Some versions merely detect the existence of such a leak, which
they report back to you when the program terminates. You're
then pretty much on your own in trying to find out where and
why the leak occurs.
Other runtime debuggers are able to detect exactly which line of
source code actually caused the memory to leak, and are thus much
easier to use to solve this type of problem.
Dynamic memory allocation statistics
A very useful thing to know about your application is how much memory
it is allocating. This may allow you to find unusual problems or to
optimize memory usage in ways that improve your products.
Most runtime debuggers are able to print reports of dynamic memory
use. You should investigate how this is done and how various types of
memory are accounted for. Tools that display this information
graphically are especially helpful.
How hard is it to use the runtime debugger?
One of the virtues of runtime debuggers is that they are typically
much easier to use than conventional tools. However, you should try to
understand the options available for checking your code with a runtime
tool.
Some runtime debuggers require that you simply re-link your
application in order to begin detecting problems. This type of
debugger is extremely easy to use.
Other types of runtime debuggers may involve recompiling some or all
of your source code. Typically, this process is also very
straightforward, although it takes a little longer to recompile than
to just re-link.
The differences between these two models are usually revealed by the
particular capabilities of the runtime debuggers. A debugger that
operates both at compile and link time typically knows more
about your application's behavior and can be more specific in its
error diagnoses. This is often related to the "heuristic
vs. exact" tracking mentioned earlier, and can also affect a
tool's ability to detect memory leaks.
Some tools can operate either at link-time or at compile-time,
allowing the user to control the trade-off in performance against the
time required to use the software. The fast link-time checking can be
used for a quick analysis and the slower recompilation for more
in-depth checking.
Can the runtime debugger deal with sophisticated programs?
More and more applications are taking advantage of sophisticated UNIX
capabilities when they execute. You should make sure that your runtime
debugger will be able to work successfully with these
applications. Some specific questions you probably should ask are:
- Does the debugger work if the program forks?
- Does the debugger work if your application spawns a task on a
remote workstation, e.g. in a client-server model?
Can error-detection be done at customer sites?
One of the best reasons to use a runtime debugger is to catch the
hard-to-find problems that often escape your own in-house
testing. Another type of problem that you would like to be able to
solve is the customer bug that cannot be reproduced in-house. This may
be because you don't have access to the user's data or hardware
configuration. In these cases it is very useful if the code generated
by the runtime debugger can be shipped to, and used at, a customer
site. Your product support team then has a way of diagnosing problems
in the field.
How do you know what you've tested?
Your goal in using a runtime debugger is to catch all the
errors in your application before your customers find them for you!
But how do you know how much of your code has been tested when you
ship it?
Some runtime debuggers support a "test coverage" tool which
is used to analyze the amount of your source code that has actually
been tested. This capability, if available, can be combined with your
in-house testing procedures to develop a testing regime that executes
as much of your product as possible.
What does the debugger do with libraries?
Many applications make use of software libraries at run-time -
e.g. UNIX system calls, the X Window System, Motif, etc. What the
runtime debugger does with such libraries is an important
distinguishing feature.
One option is to actually go inside the library and check the code
there, reporting errors just as though this code were part of the
user's application. If you have access to the source for the library,
this may be valuable, since you can then just fix the problem and run
again. As often as not, however, you won't be interested in errors
within the library itself, and will simply tell the runtime debugger
not to bother reporting them anymore.
The second option is to check calls to libraries when they are made,
and when they return, for such problems as illegal argument data
types, invalid parameter values, etc. This approach assumes that
errors which cause the library to crash are typically caused not by
bugs in the libraries themselves, but by errors in the way that user
applications call the library functions. With this type of checking,
errors in your code, which you can and should fix, are reported, but
not the resulting problem within the library.
Does the debugger support all your development platforms?
Most organizations do their development work on one type of
workstation, and then port the resulting product to the other
platforms that they support. The majority of the (easier) bugs are
eliminated on the initial platform, but the real problems almost
always remain after the code has been ported. It is important,
therefore, that your runtime debugger be able to support your product
on all the platforms to which it has been ported. This also simplifies
the porting process.
Pricing & Licensing for your development staff
Once you've decided on the set of features that you want your tools to
have, you should think about the cost. Because of its power, the
runtime debugger is probably going to become a key component of your
development effort - everyone in your staff is going to want to use
it.
You should consider the pricing of the products, in particular:
- How much would it cost to have many users simultaneously using the
product?
- How much would a site license cost?
- How much is a site license on all the platforms that you use?
|